Jun 25, 2026
Jun 25, 2026
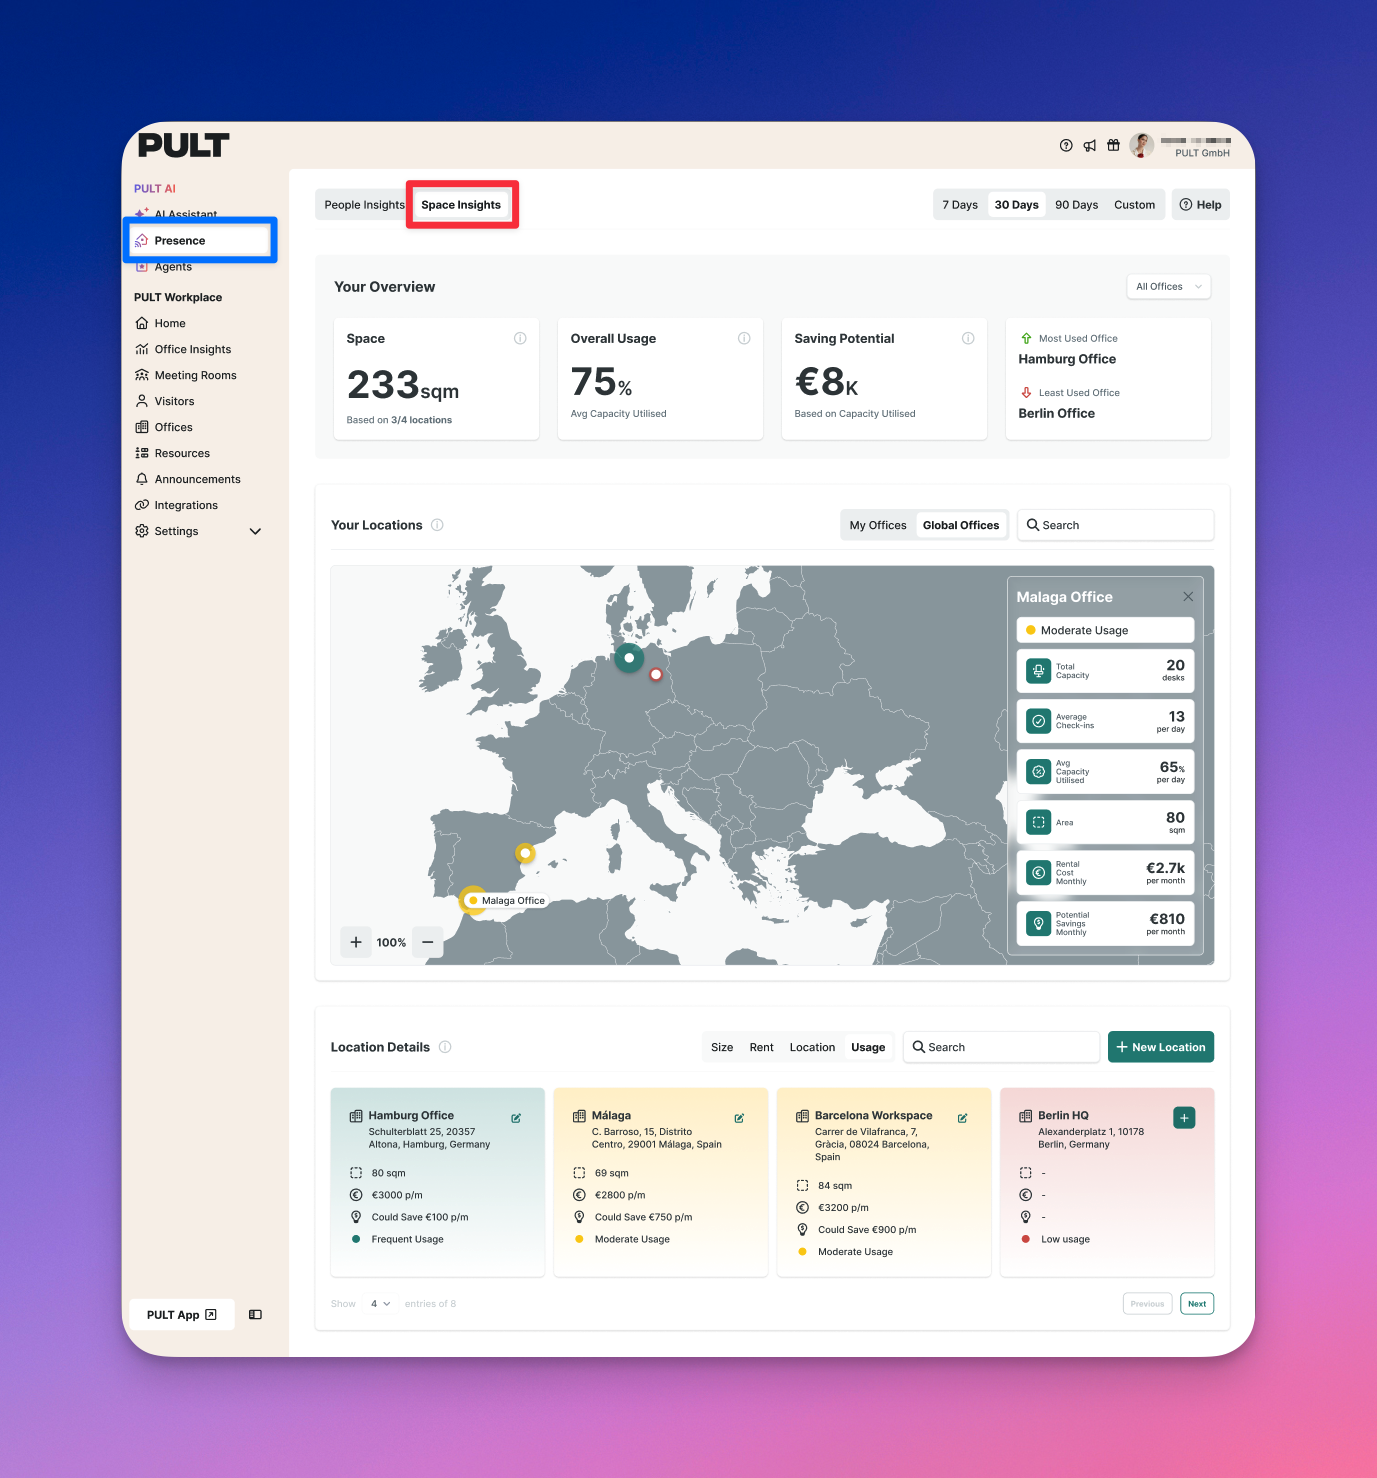
Occupancy Insights Dashboard
Introducing Occupancy Insights — your office portfolio at a glance. A new Occupancy Insights tab gives you a bird's-eye view of how your offices are being used. See overall capacity utilisation and saving potential across all locations. An interactive world map shows colour-coded pins for each office, and clicking a pin reveals detailed metrics like average check-ins, capacity, size, and rental cost. Below the map, a searchable location list lets you compare offices side by side, sort by size, rent, or usage, and add or edit location details directly. All data is fully anonymised — no individual-level information is shown.