Nov 26, 2025
Nov 26, 2025
New Features: Presence Average Attendance Insights
We’ve introduced several new features to the Presence Average Attendance graph to improve usability and ensure data is shown appropriately based on permissions:
-
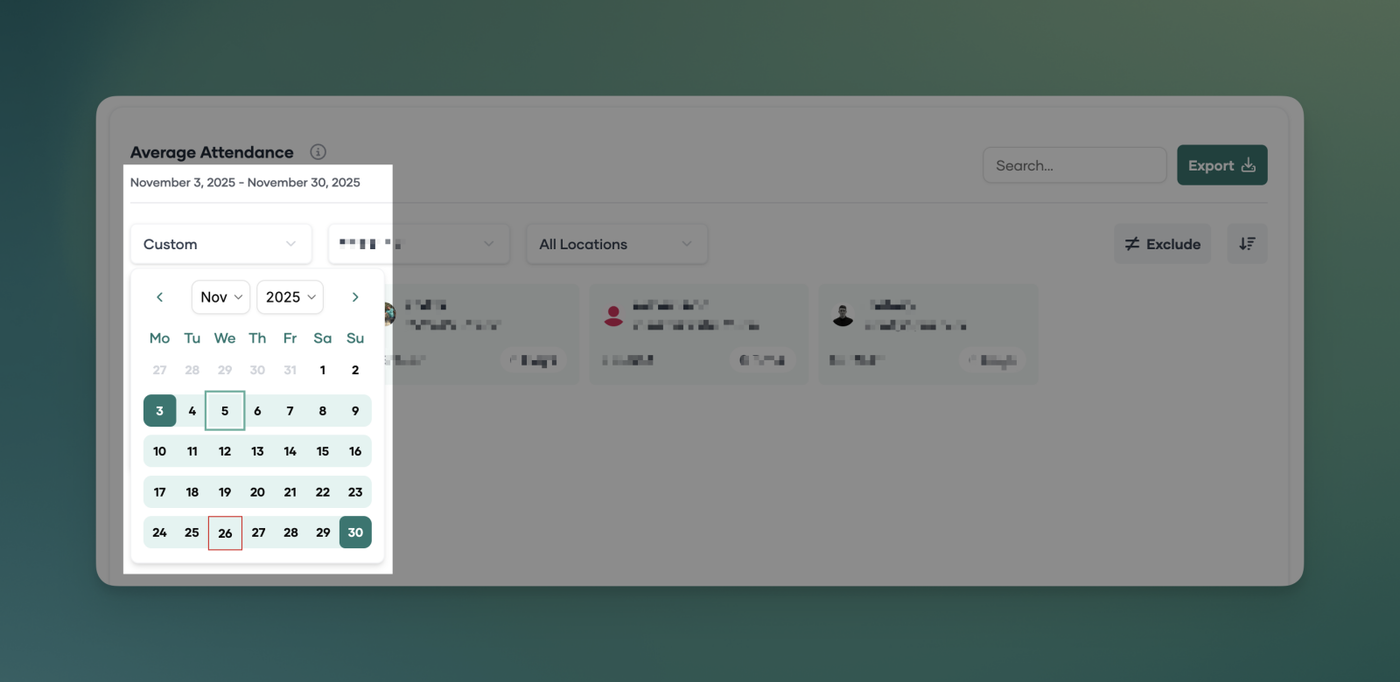
Custom Timeframes
Users can now select custom timeframes for viewing average attendance. -
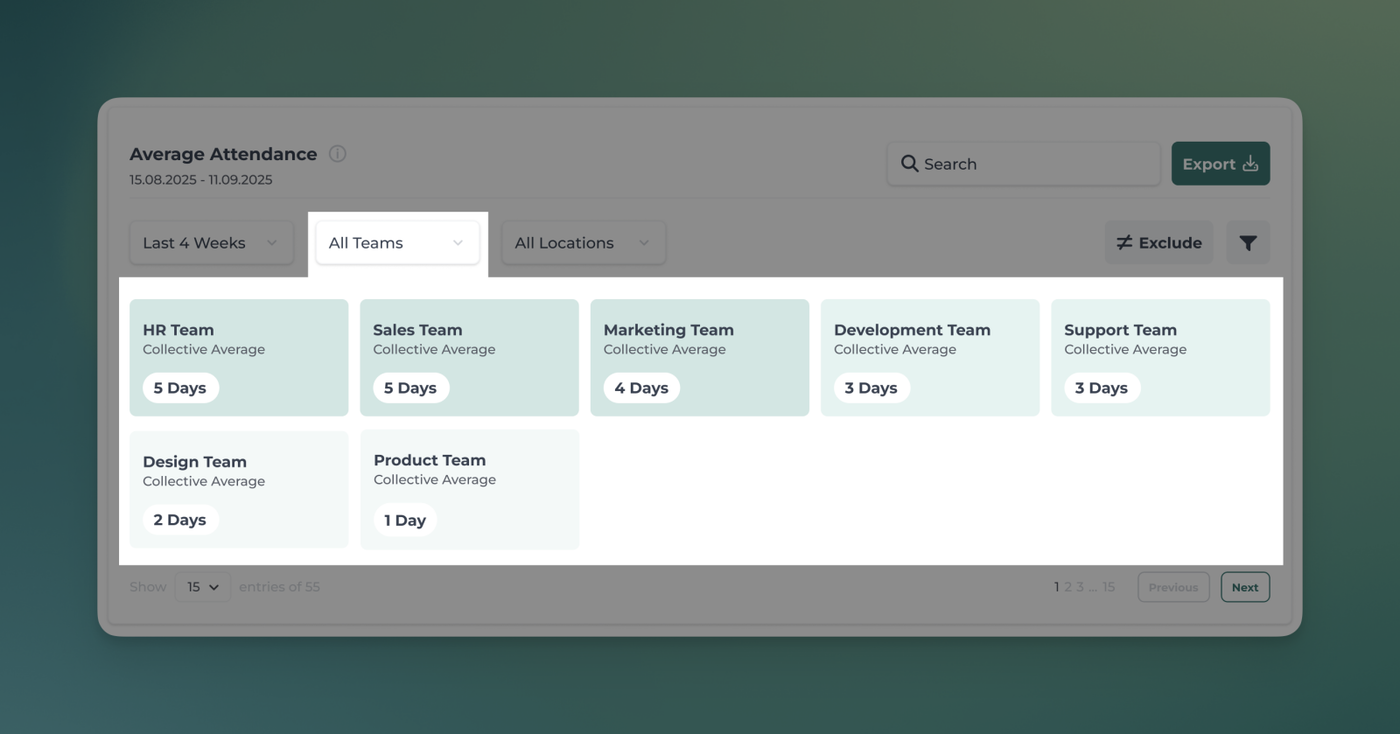
Team Average Attendance Display
When filtering by team, the graph now shows the team’s average attendance for better group-level insights. -
Permission-Based Employee Visibility
If permissions restrict access to individual employee data, the graph will automatically hide individual average attendance and display only the team average. -
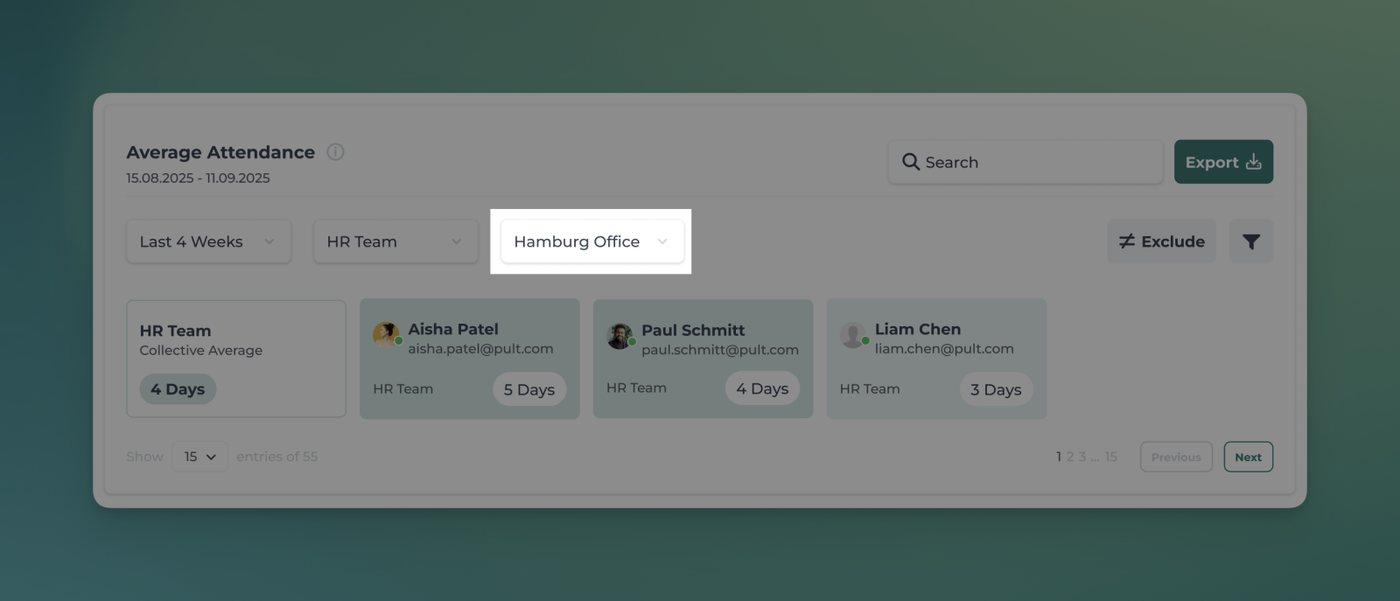
Location Filter Added
You can now filter the graph by location, allowing clearer comparison across different sites.
1. Custom Timeframes
2. Team Average Attendance Display

3. Permission-Based Employee Visibility
4. Location Filter Added